


Ever since I got my AWS SAA certificates, I have been eager to challenge myself with real-life projects. A few weeks ago, I stumbled upon a challenge hosted by a cloud guru , and I did not wait for a second and jumped right in. It has been quite a lot of fun learning and doing the project for the last few weeks, and I am excited to share it.
This project aimed to develop an ETL processing pipeline for COVID-19 data attained from the New York Times and John Hopkins sources, using Python and various AWS cloud services. This project incorporated the following AWS services:
- S3 Bucket
- Glue Crawler
- Glue Database
- IAM Roles
- DynamoDB
- EventBridge
- Lambda
- Cloudwatch
- SNS
The following Tech Stacks were also used to develop this project:
- Python
- AWS
- The Serverless Framework
- Github
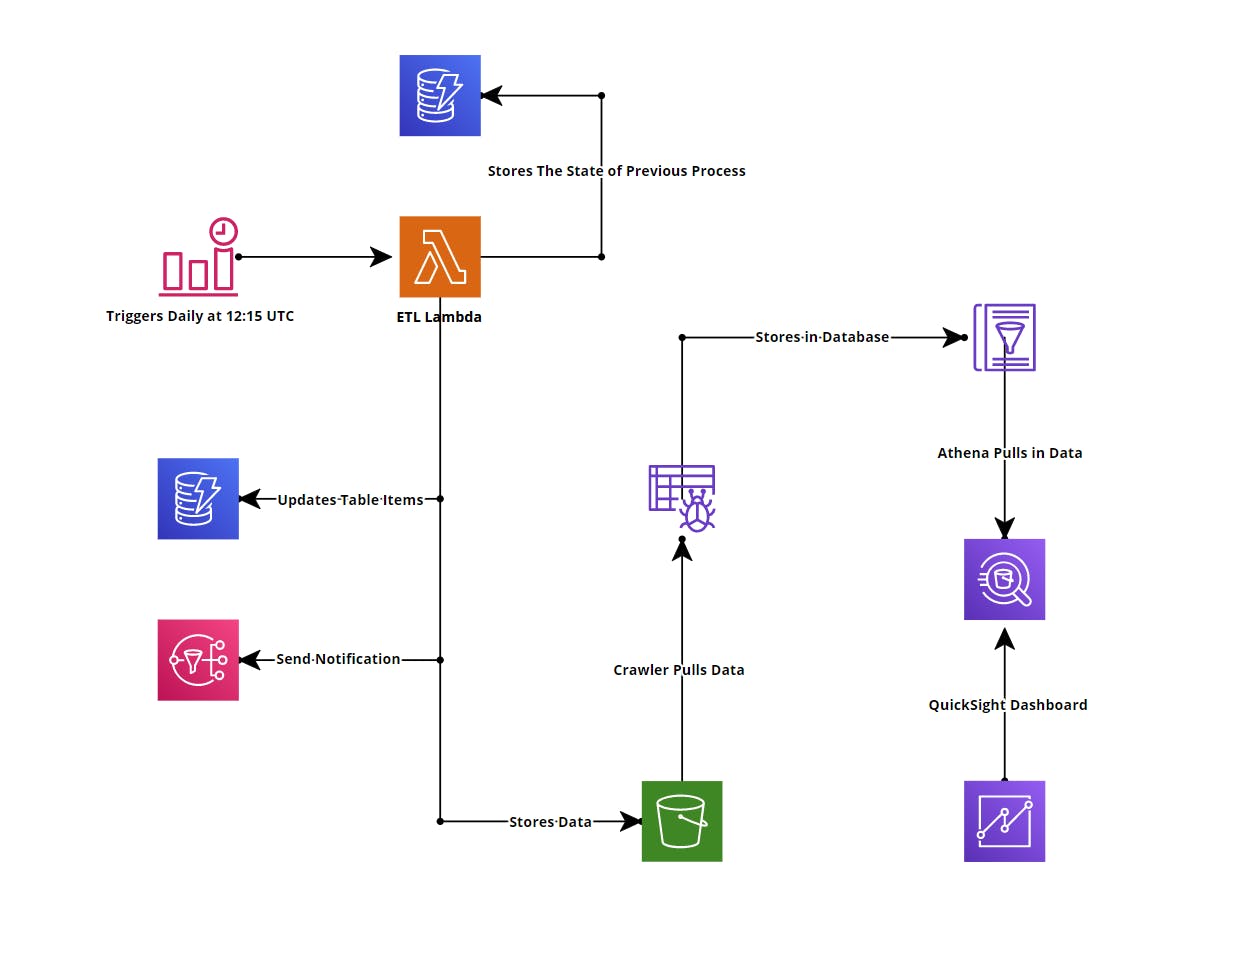
To begin this project, I first visualized all the designs, so I have a clear idea of approaching it. Below is my first mockup of the project. And following that is my final Infrastructure Architecture.
Initial Infrastructure Architecture
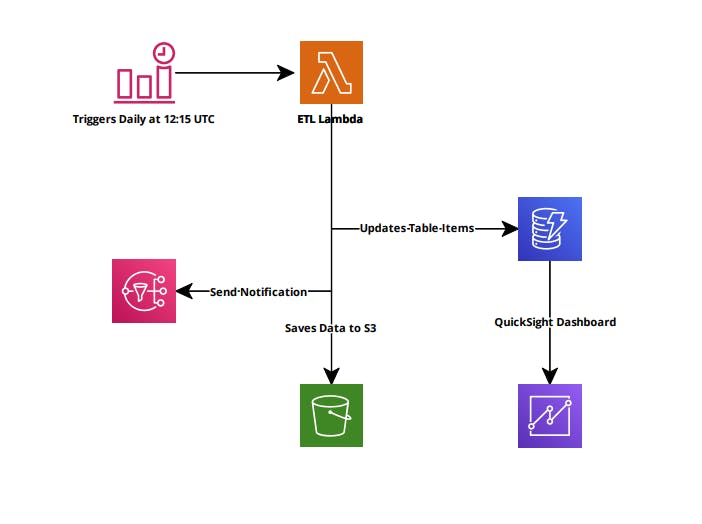
Final Infrastructure Architecture
ETL job
- One of this project's main tasks was to automate it to run daily to fetch the latest data. I used Amazon EventBridge (Previously known as Cloudwatch Events Rule) to set up my cron job daily at 12:15 UTC. It was a simple task and was reasonably quick; however, I did not implement this feature until I had most of my lambda functions ready later in the process.
Extraction
- The next step of the project was to write a lambda code in Python, which would download both New York Times and John Hopkins data and save it in memory. This was relatively simple to implement. I used Pandas to take care of this and kept data in a data frame.
Transformation
- In this step, I had to perform some data manipulations on the data downloaded from the sources mentioned above. First, I had to convert the date fields of both them to a Date object and not a string. Then combined both of the datasets by doing an inner join on the date using pandas. And finally, filtering all the non-US data from the John Hopkins dataset.
- While I was working through this step of the code, I found several instances where there were “NaN” data. To resolve this issue, I used another Pandas method, fillna(), and replaced it with a “0”.
- At first, I designed my project so that after it has downloaded the data, it would save it to an S3 bucket, and then an S3 event would trigger the transformation function. This was a tedious workflow and didn’t quite work well. However, as I progressed through the project, another step stated that the transformation code should not know where the code is stored, or it should know anything about databases and that it should be included as a python module. I made this entire task into its module and called it in my index python code. This made it reusable by other sections of the project.
Load
- The next step of the project was to save the data somewhere. I decided to use DynamoDB as it’s a robust and super-fast NoSQL database. I used Boto3 to read, write, and update the transformed data into my database. I also implemented a mechanism to restrict itself from overwriting data based on the partition key if it already exists.
- I also implemented several errors handling mechanisms in this module. First, I verified if the date field is appropriately formatted and then confirmed if other fields are Integers and have values greater than or equal to 0, meaning there shouldn’t be any data with empty fields. If, for some reason, the code detects an error while running, the process will end and save the data in an S3 bucket.
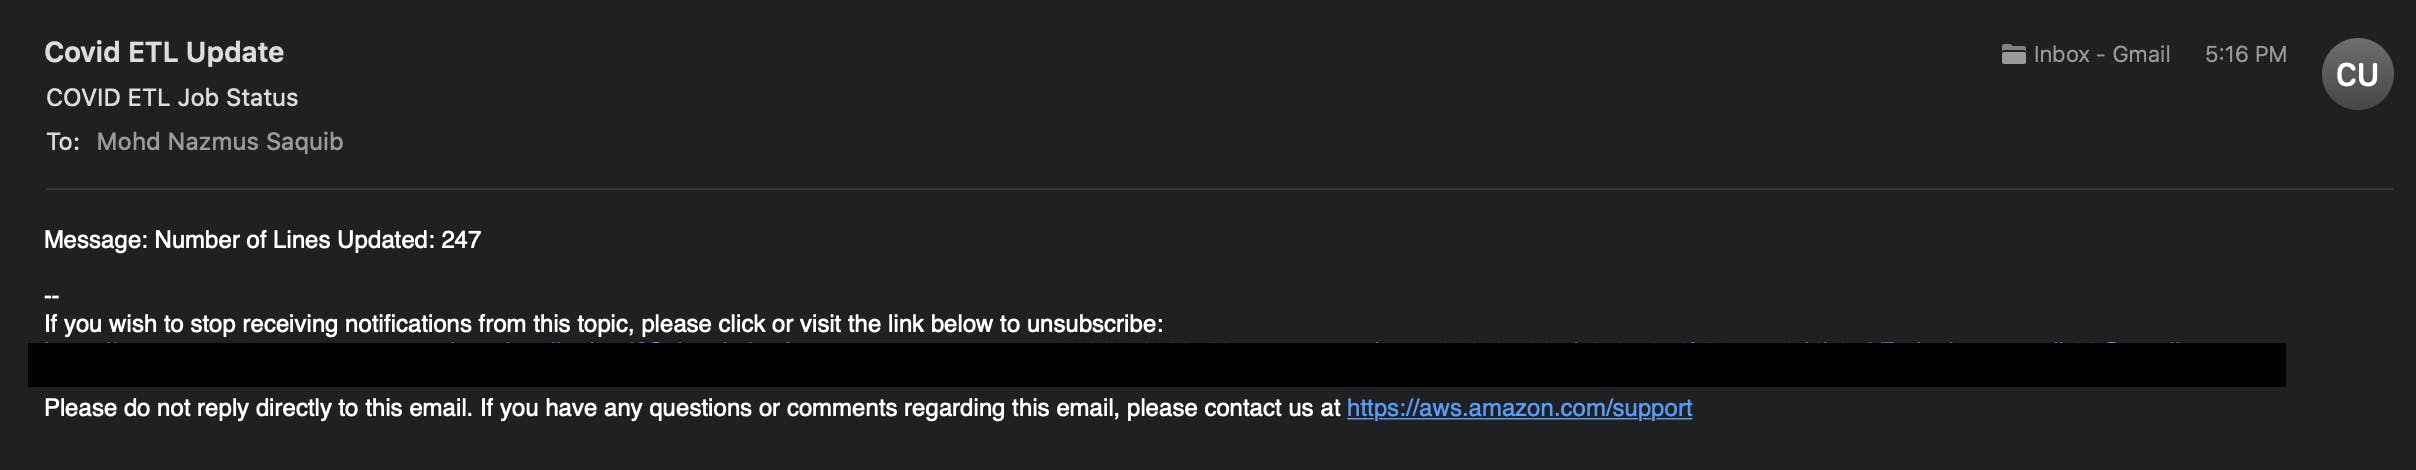
- I implemented SNS to notify me if the process failed or passed. If it passed, it would tell me exactly how many rows were updated on a given day. If the operation failed, it would notify that the process failed and the row of that data where it failed and why.
- One of the main steps of this task was that if the code failed at any point, it should remember that it failed. And to take on this, I deployed another DynamoDB table that would solely keep track of the process. So, if my code for any reason fails midway, it would set the field in to “Failed = True.” And on the next run, my code would read this database to see my previous process's status. If the code failed previously, then the function would process the old data first, and after it has successfully loaded the data in, it would go ahead and process the latest data. If the previous process successfully went through, my lambda function would only process the latest data.
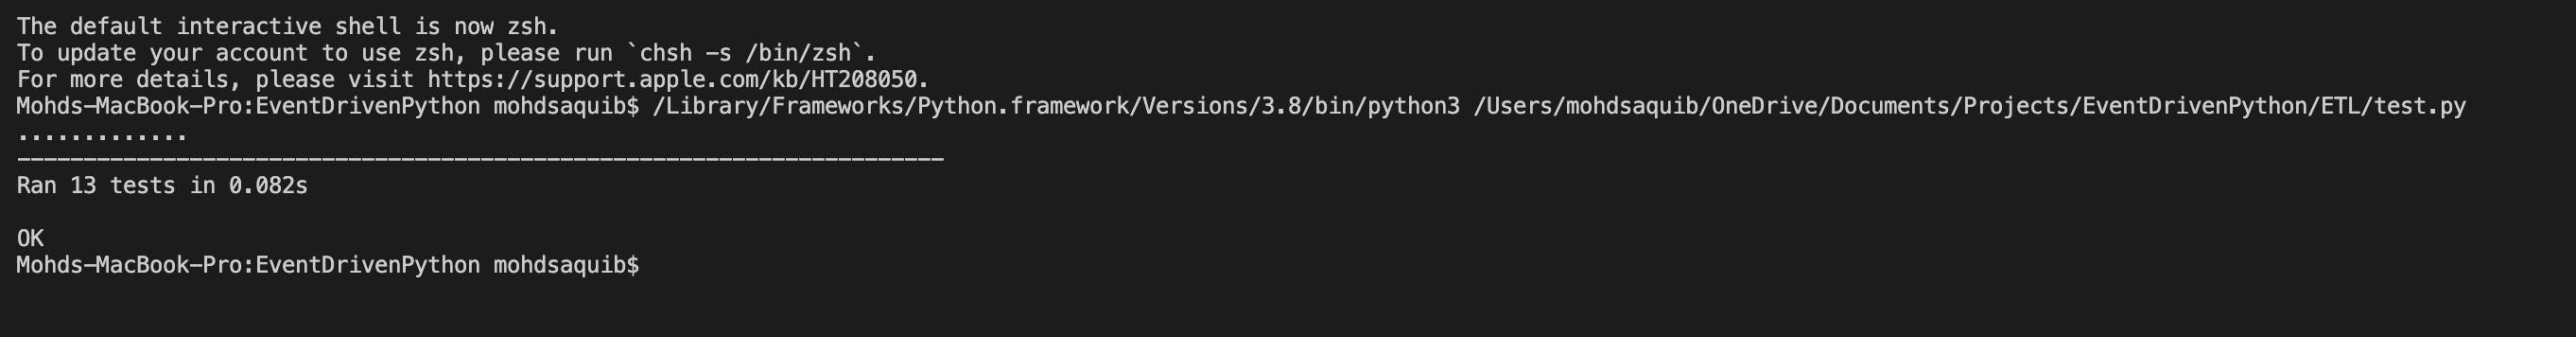
Tests
- To ensure the code could handle unexpected situations, I wrote a couple of tests using Python’s built-in test module, unittest. I have never written any tests before, so it was new to me. I spent a couple of hours learning and writing tests. It was pretty simple to implement. This helped me identify if any problems occurred to my main functions after updating them. I also added some of my custom data to test my primary functions.
Infrastructure as Code (IaC)
- As you can see, the entire project is serverless and did not require any servers to run any of the processes. I used The Serverless Framework to write my infrastructure out. Why did I use The serverless Framework? Its because it is getting viral as the cloud industry is growing. It also emphasizes on serverless architecture and is super duper SIMPLE to use. Another reason was that it helped me package all of my python dependencies with a simple command. Not only that, but the serverless framework also allows other third-party dependencies that can be used in your serverless.yml. It is pretty much similar to writing CloudFormation templates with extra benefits. Another big reason why I chose this was that you could deploy your entire infrastructure with a simple command and delete it with another simple command.
Dashboard
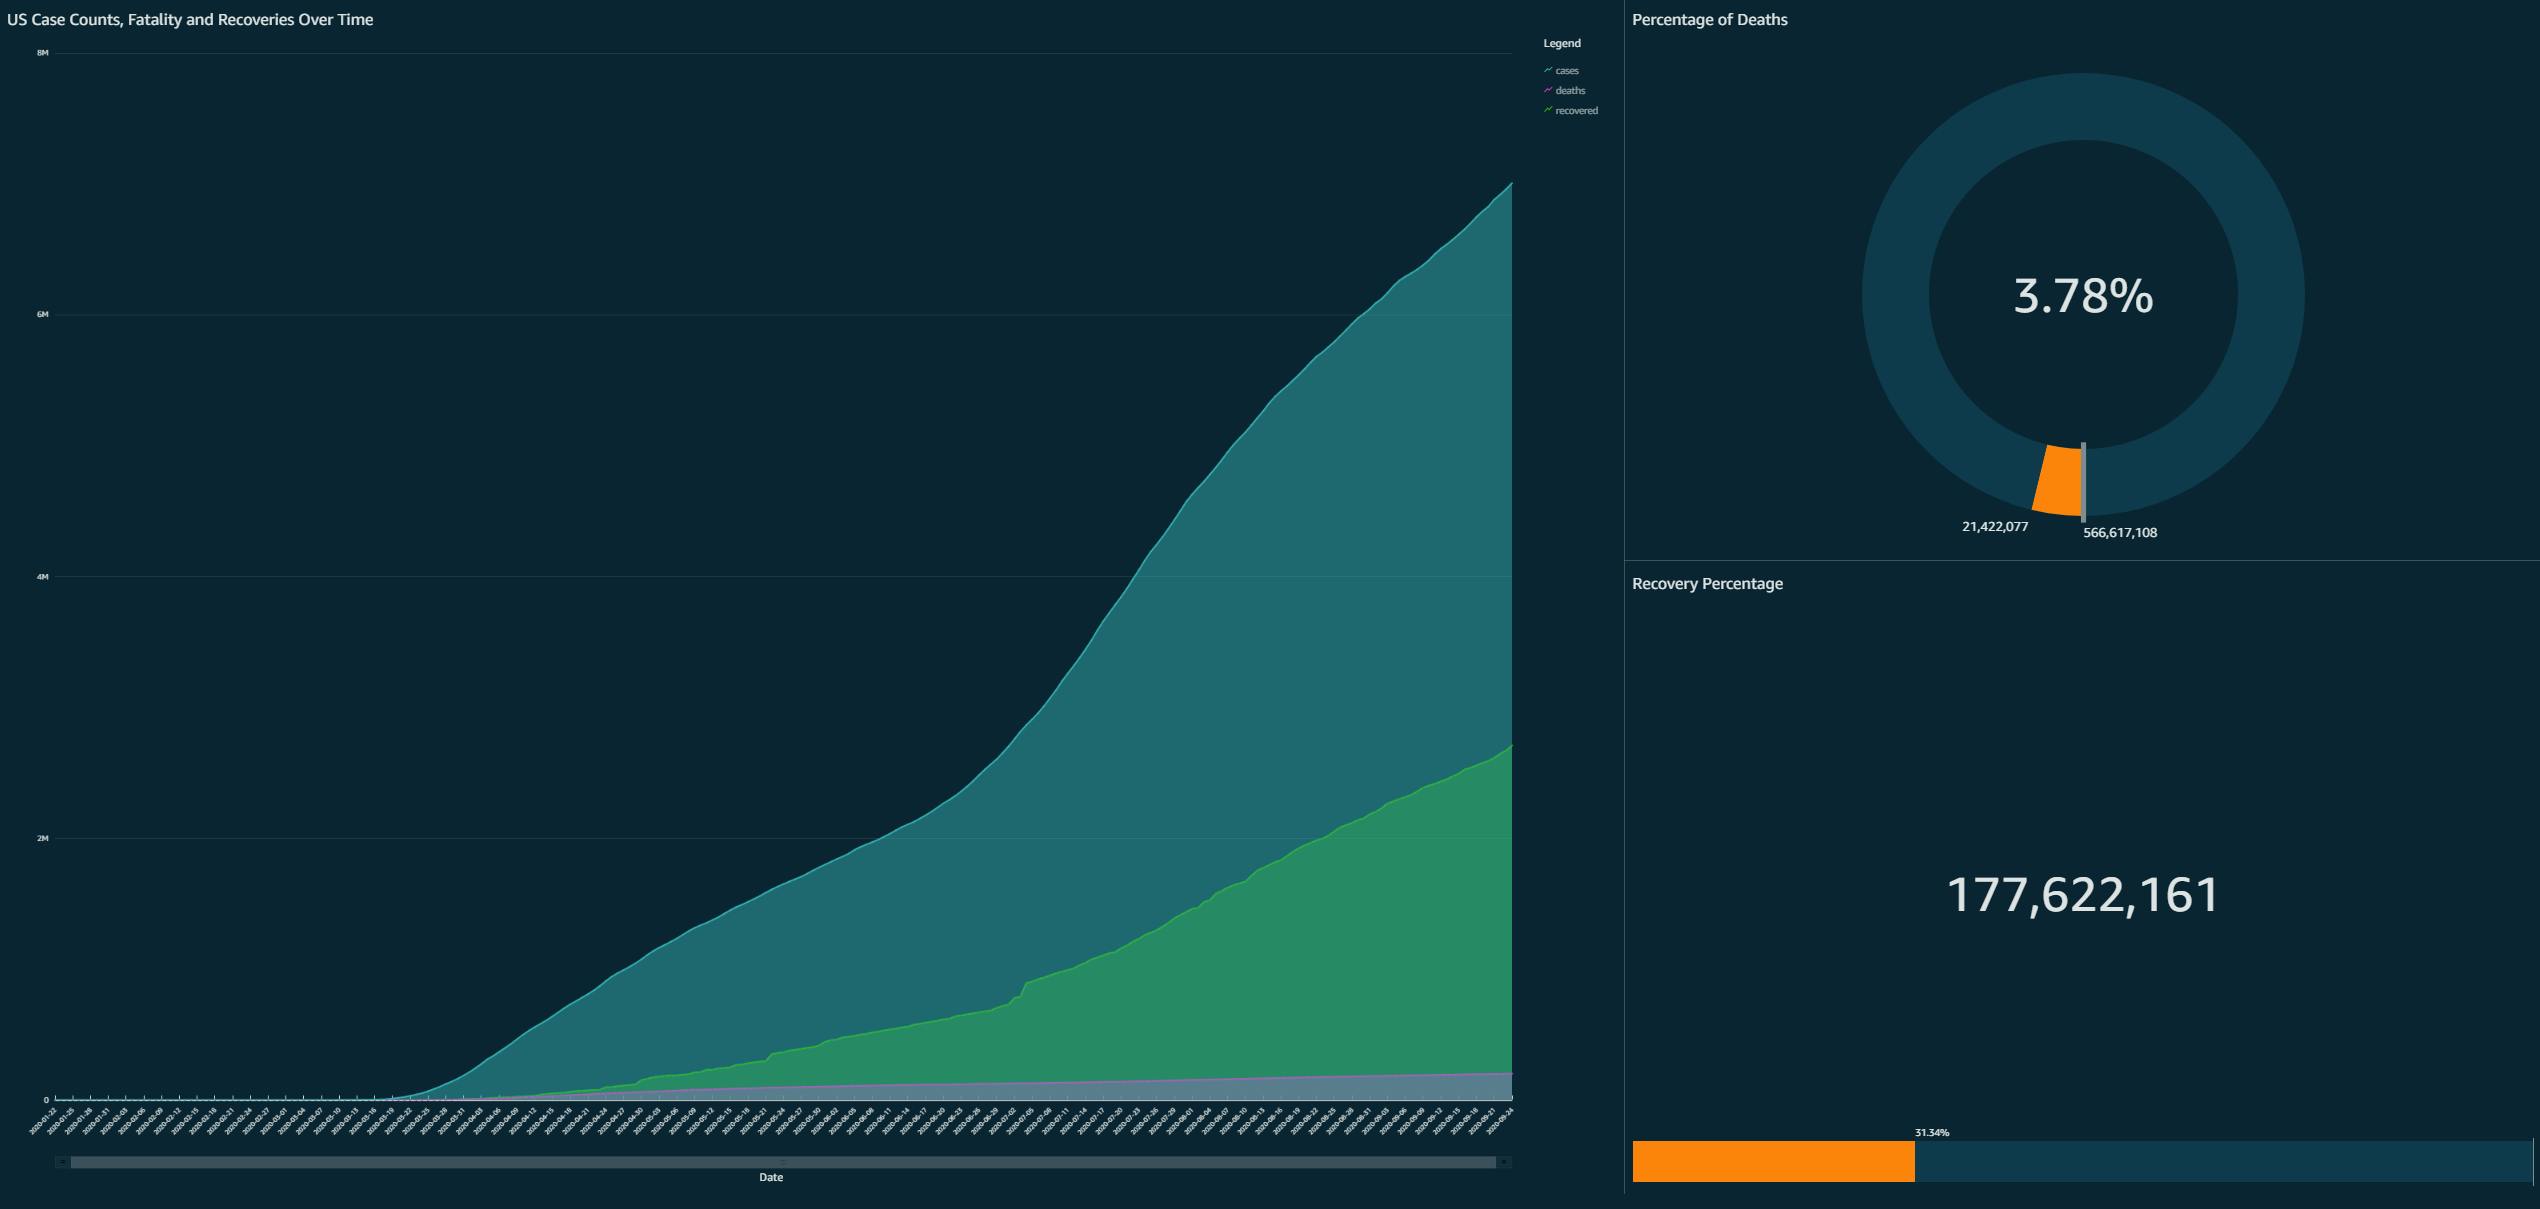
- Oh, Boy! Where do I even start? Initially, I thought this would be the easiest step for this entire project. However, it did not turn that way. Initially, I planned to use AWS QuickSight to display my data in a dashboard, however mid-way through the project, I found out that DynamoDB isn’t supported with QuickSight yet. Bummer! I had to find another way to deploy my dashboard, so I then thought about using Tableau Public. However, there is no support for AWS to connect with Tableau Public version, its only available for the professional version, so that was out of the question. I did more research and found out that QuickSight works excellently with Amazon Athena. I had to restructure my code a little bit for this work. First, I changed my load function to save my data after being loaded to a Processed S3 folder. After that, I implemented AWS Glue Crawler, which would pull in the S3 Bucket data and put it inside the AWS Glue Database. Then from there, it was pretty straight forward; the data would automatically populate over to Athena. And in QuickSight, it was simple as clicking import data from Athena. Below is a static image of QuickSight Dashboard.
Working on this project was fun and made me learn tons of new things. I cannot wait to tackle more challenges in the future from A Cloud Guru. I am also in love with The Serverless Framework; it is easy and intuitive to develop any cloud infrastructure. I recommend anyone interested in the cloud to take on this project. Not only will this project help you understand several AWS services, but it also enhances your Python skills.
Github: ETLCovid19Project
LinkedIn: Mohd Nazmus Saquib